Charts
The Charts screen turns the Partner's sales data into interactive analytics, drawing on the same figures behind the label's Reports.
Filters
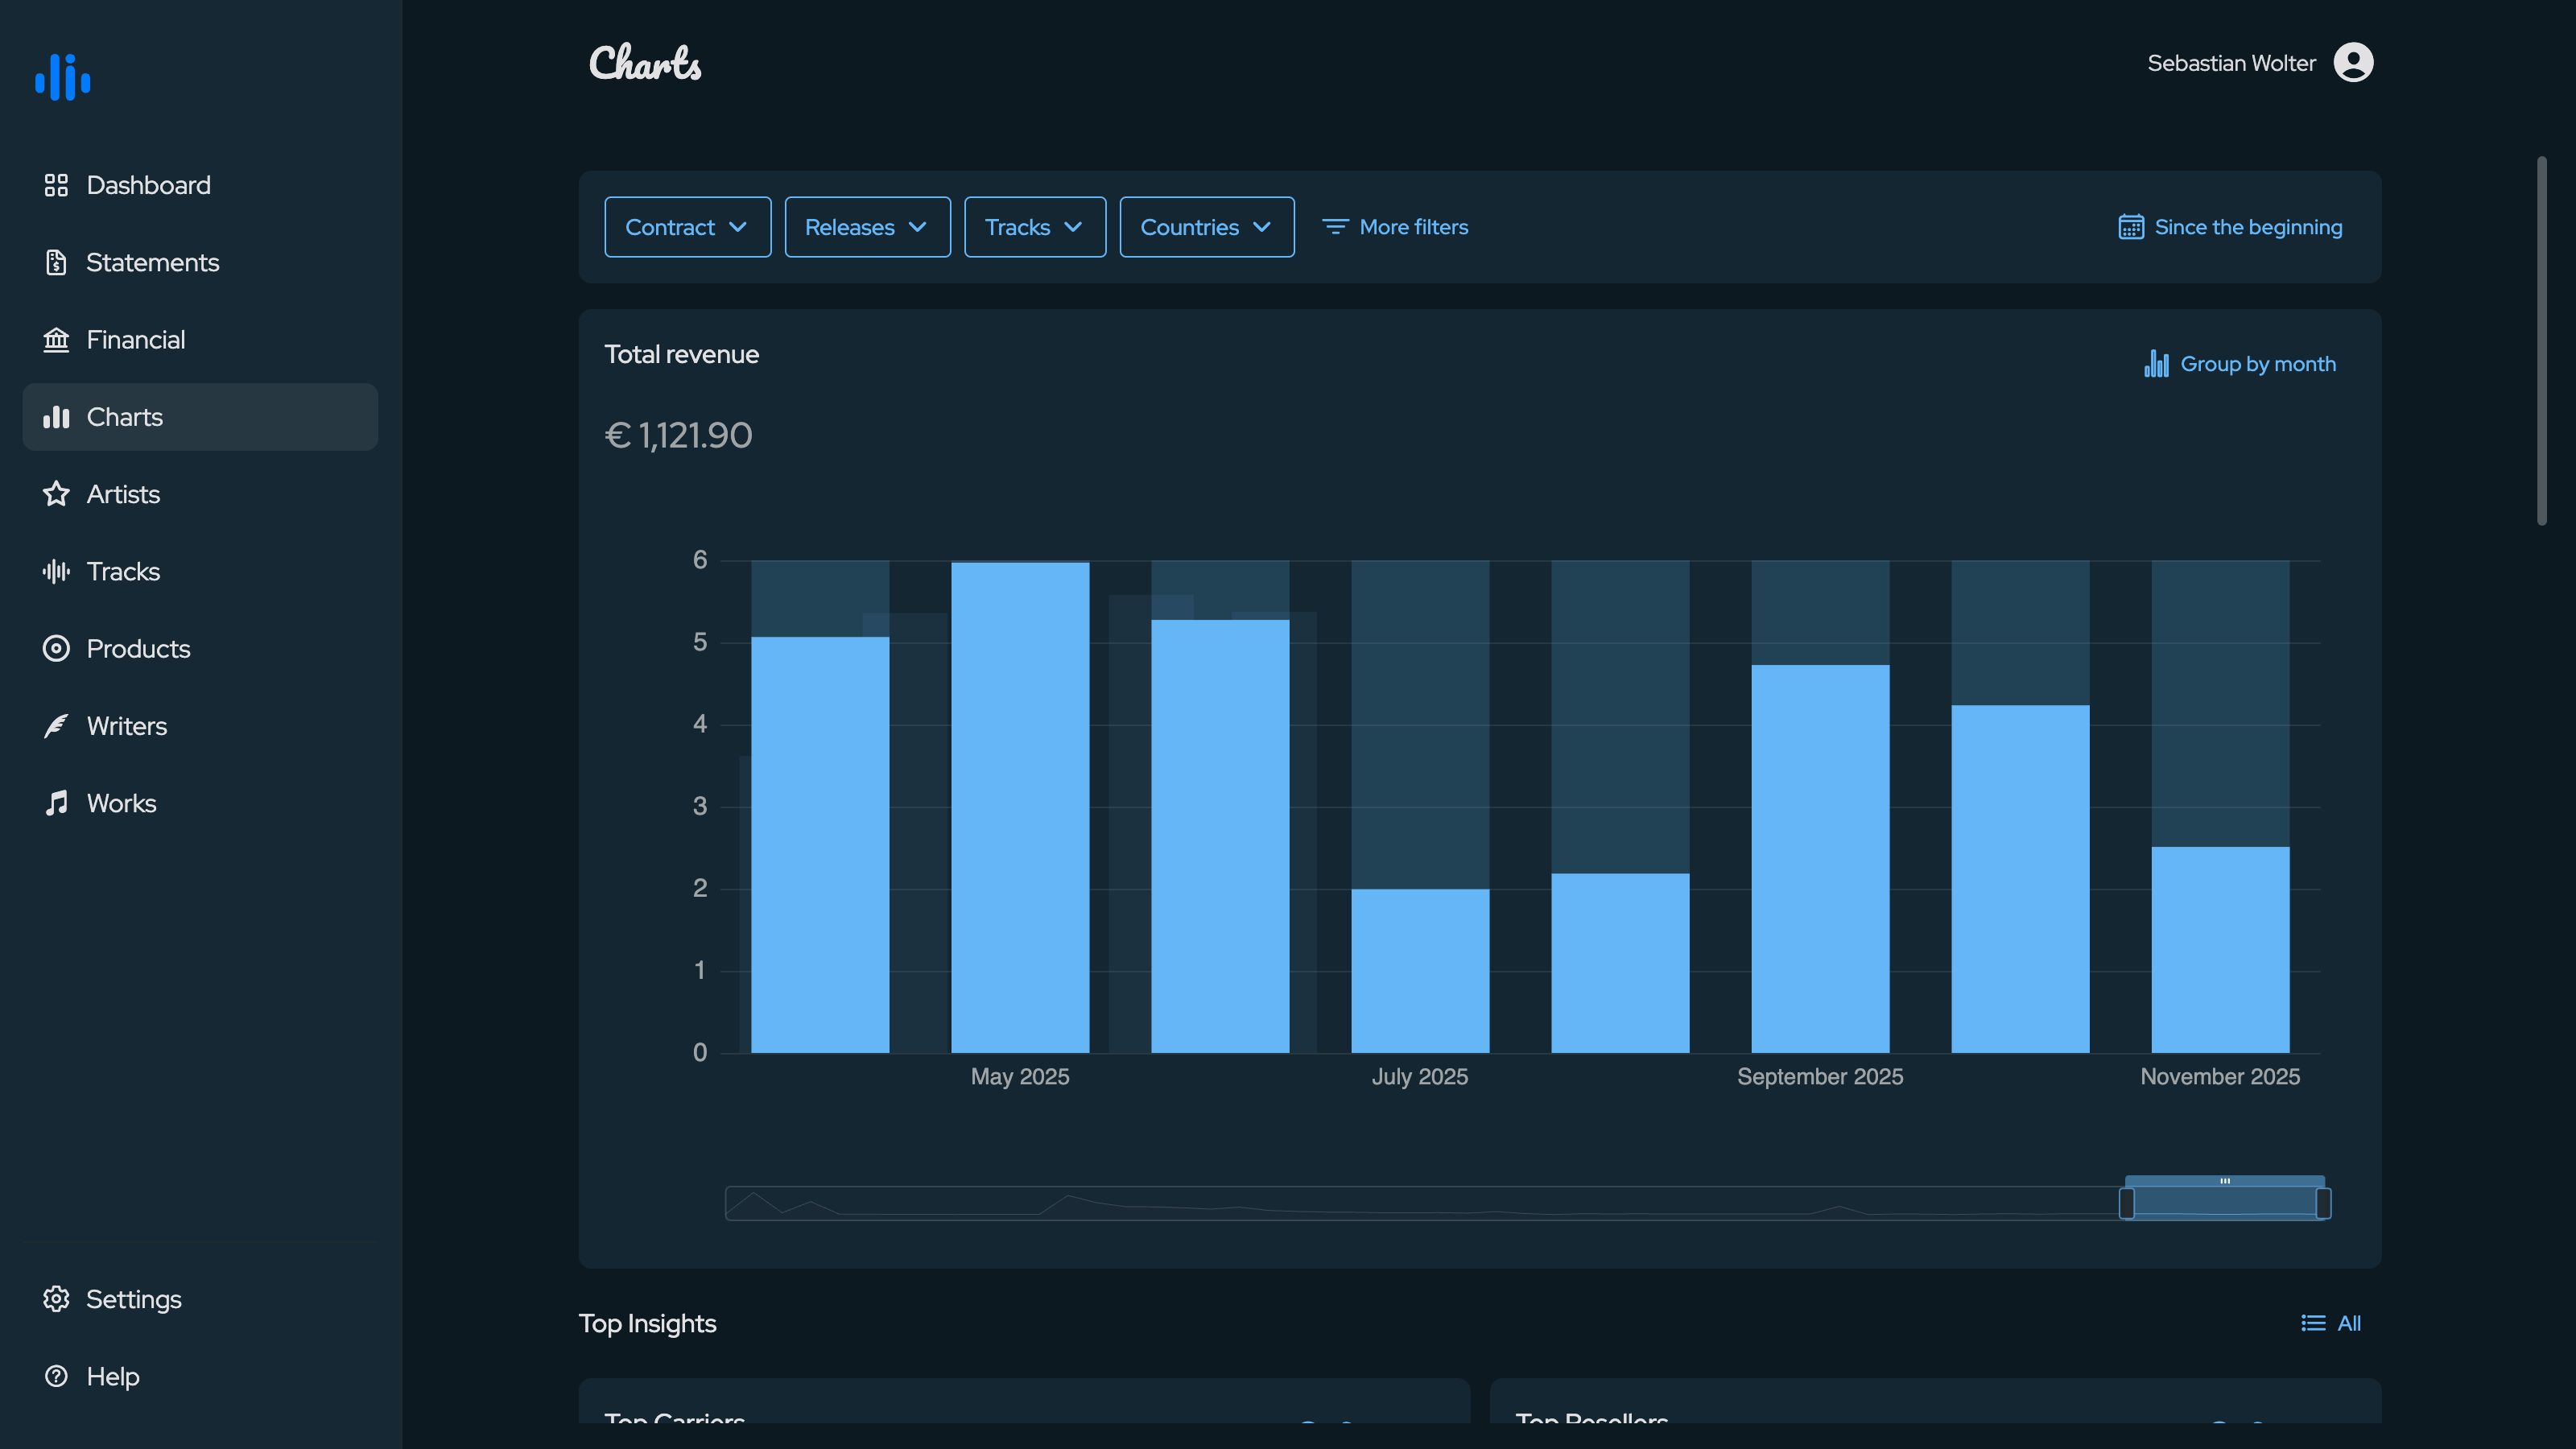
A filter bar across the top narrows every chart at once. Partners can filter by Contract, Releases, Tracks and Countries, open More filters for royalty sources, statements and sale channels, and set the date range - defaulting to Since the beginning.
Total revenue
The Total revenue card shows the headline figure for the current selection and plots it over time as a bar chart. The data can be grouped by month, and a slider below the chart lets you zoom into a shorter span.
Top Insights
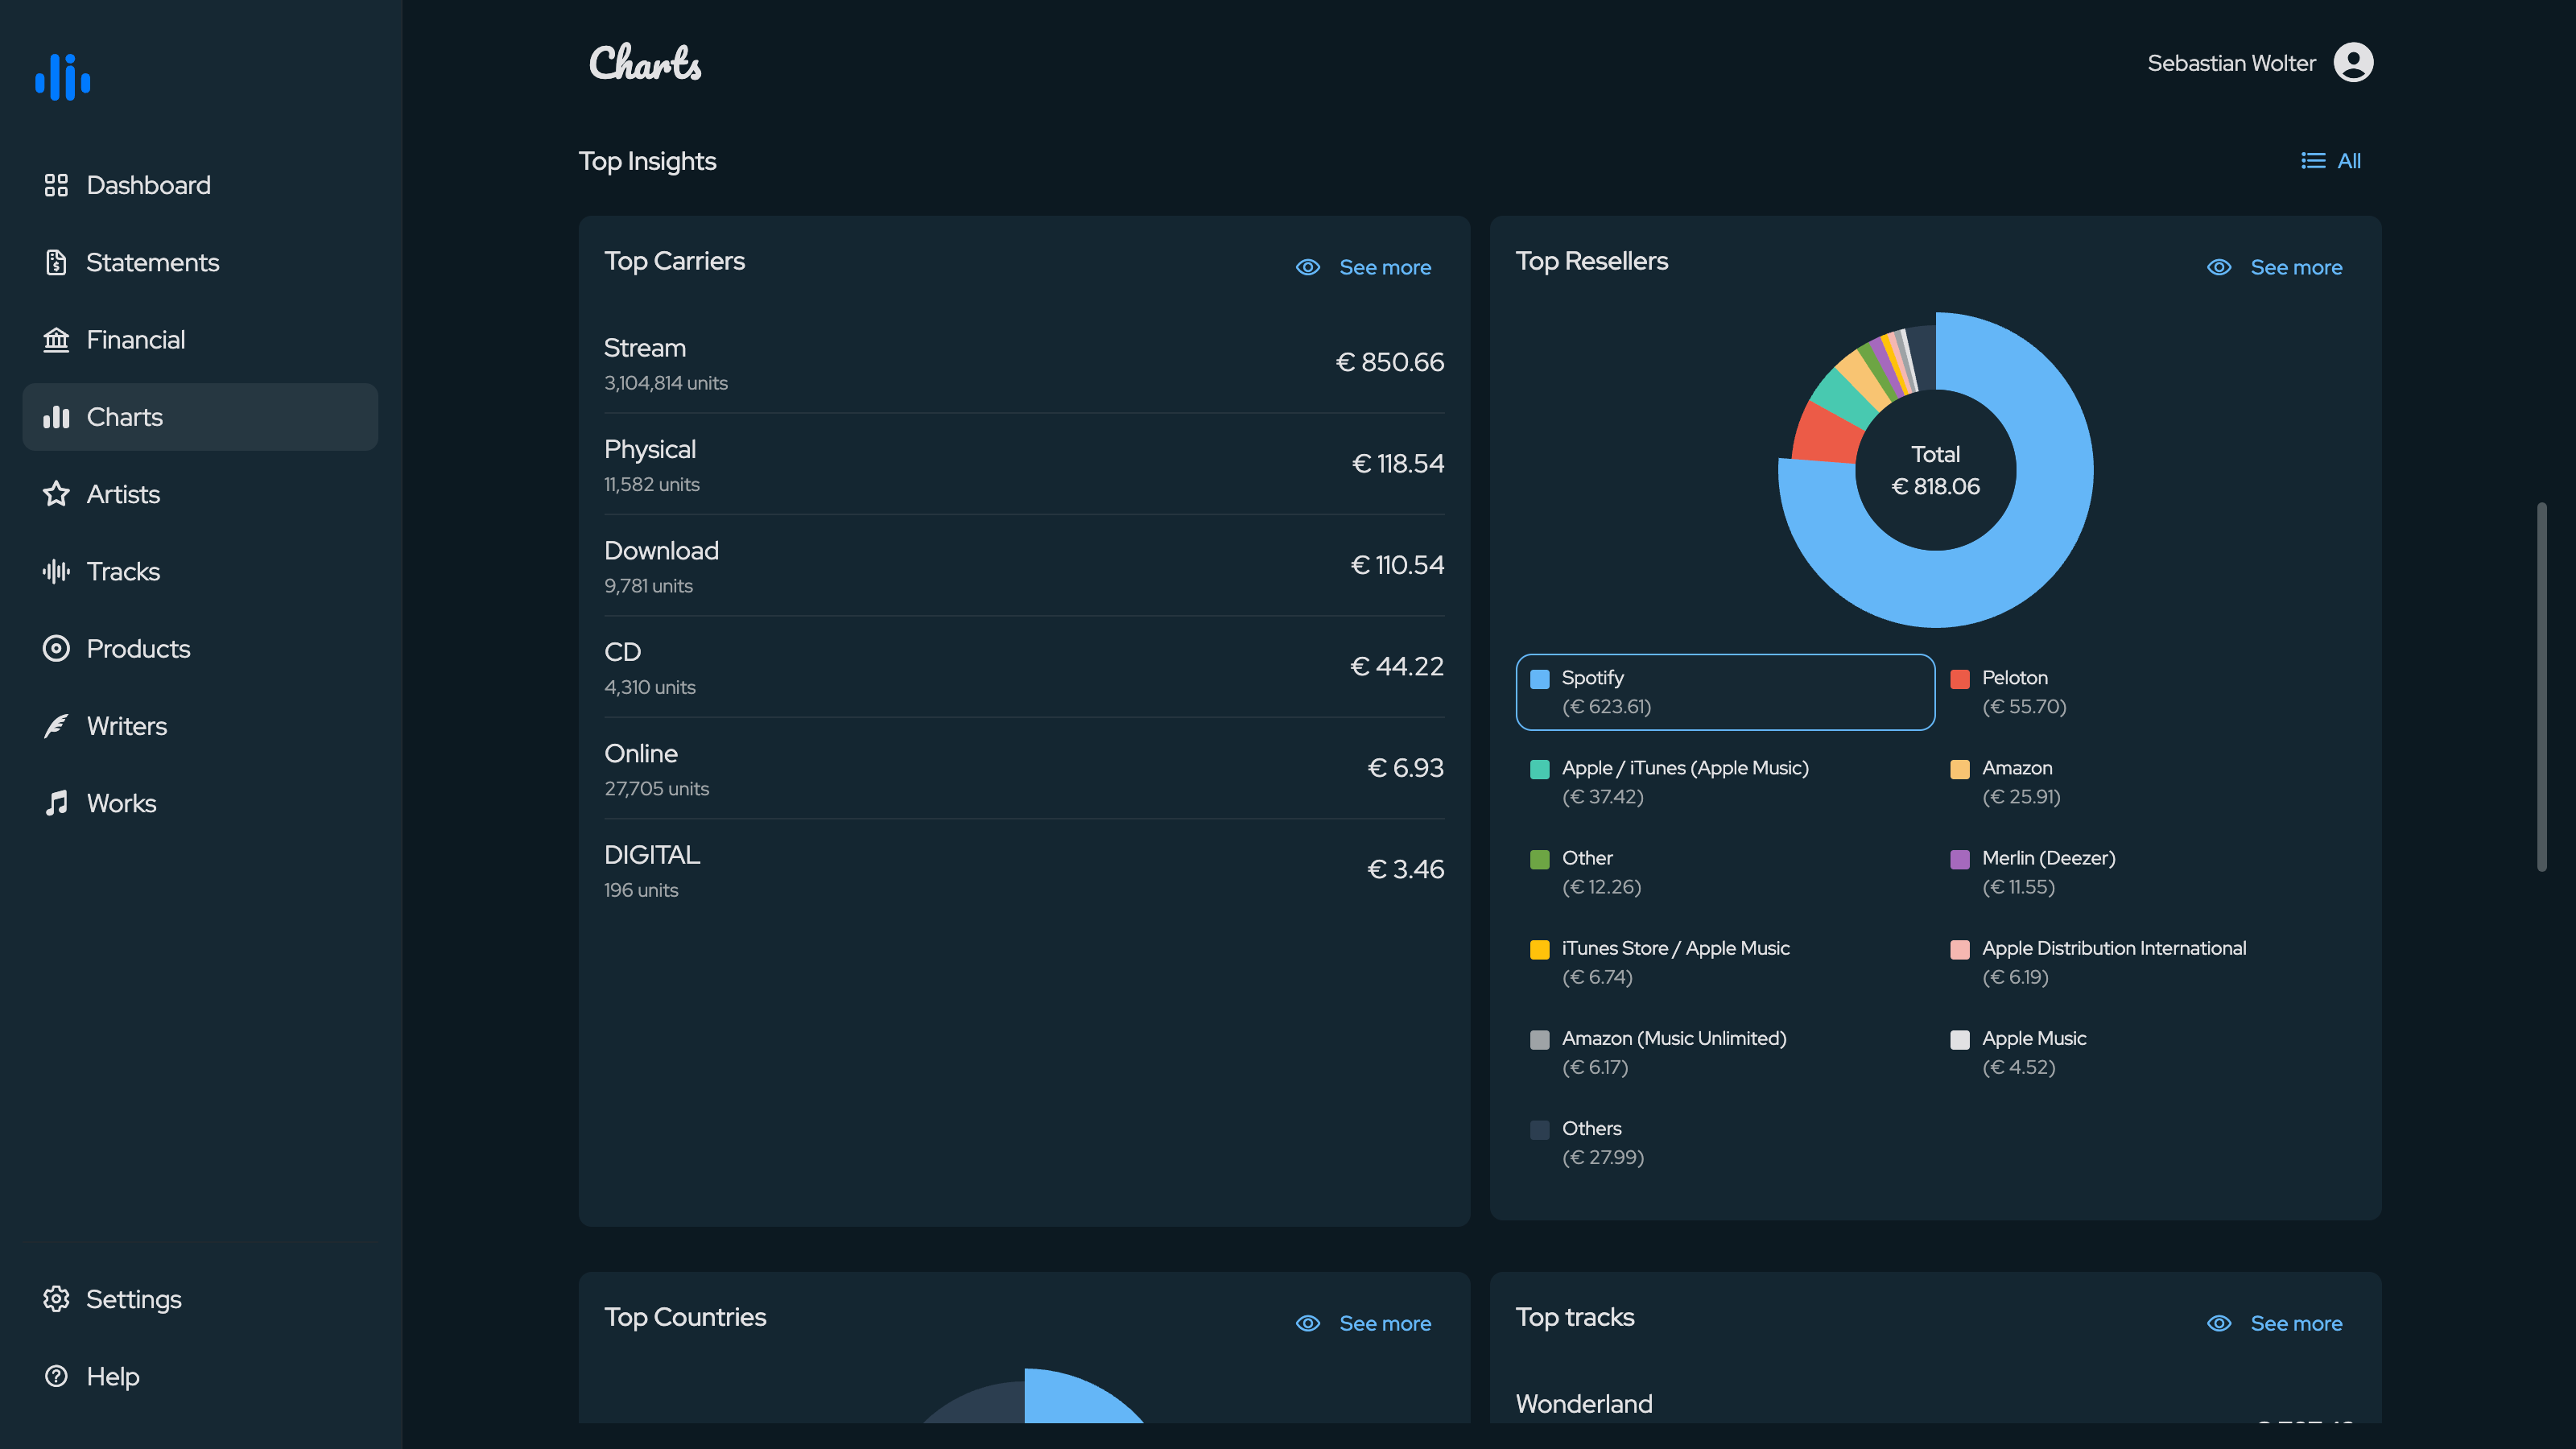
Below the revenue chart, Top Insights breaks the same data down into ranked cards: Top Carriers (stream, download, physical and so on), Top Resellers (Spotify, Apple, Amazon and others, with a share chart), Top Countries, Top Tracks, Top Products and Top Contracts. A limit control sets how many entries each card shows, and See more opens the full ranking.